Multifamily Blogs
4 Ways To Use Maintenance Data During Multifamily Budget Season

4 Ways To Use Maintenance Data During Multifamily Budget Season

For multifamily managers, budget season typically is not the highlight of their annual calendar. Off-sites, bootcamps, late nights, endless spreadsheets, stacks of reports for filter through...ugh.
A thorough, well-crafted budget often requires us to step outside of our comfort zone and deal with personnel issues and other things that personally impact people we work with/for.
If this isn't challenging enough, the budget proposal is just the first step. It is most often followed by upper management/C-level/board review and in many cases, the dreaded word - CUTS. Wash, Rinse, Repeat until you get to something that works.
OK, enough of the monotony - so how can maintenance data help?
Data collected within your maintenance operations can be a hidden gem when it comes to the overall condition or staffing of your property from a maintenance perspective. Here are four of our favorite areas to dig in:
1. Maintenance Categories/Tags
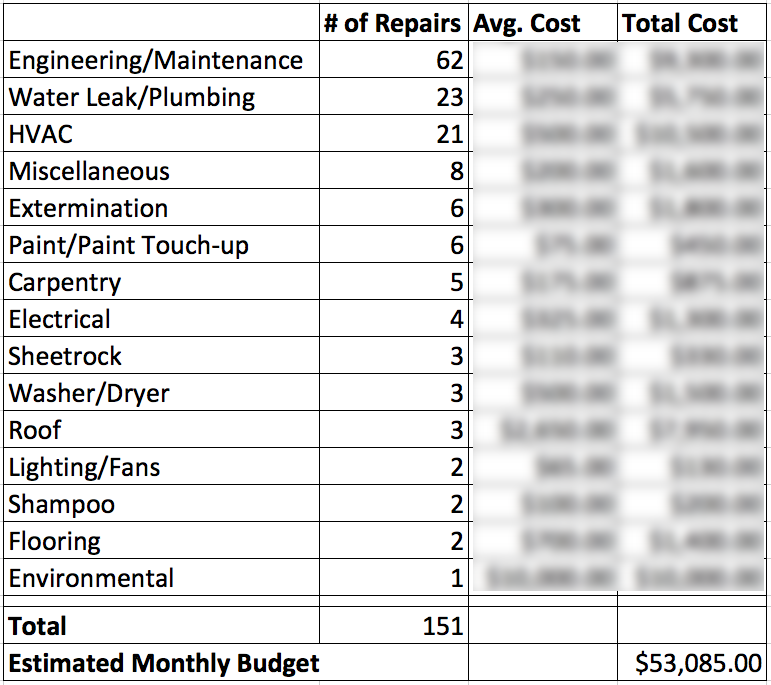
Most property management software tools do a very good job of enabling categorization of requests. Analyzing and sorting work-orders/service-requests by maintenance category (some systems refer to this as "tagging") can provide a treasure-trove of information during the budget process.
Based on multifamily industry data, the average 300-unit property generates average of 150 resident service requests per month. Add another ~50 on top of that if your sites track make-ready activities or preventative maintenance. Over the course of a year, or even just 6-months, there is a lot of harvest-able information when budget-time rolls around.
Export them into a spreadsheet pivot table and see what categories of requests you have the most frequency of, then dig a little deeper. As an example, if 30% of your 150 requests are roof leaks, and you are outsourcing those repairs, take a look at what you are spending with that vendor(s). It might be that a capital project for roof replacements is in order.
2. Geographic Heat Mapping
Otherwise referred to at Geo-mapping, this is a very powerful way to consume and articulate the frequency of repairs to specific buildings or addresses. Based on the method explained above of using categories to isolate high-volume repairs, you've identified that you are spending an obtuse amount of money repairing roof leaks.
But wait, do they all need to be replaced? A quick glance at a breakdown of roof leaks using geo-mapping* may indicate which buildings to focus on. You may also be able to learn some things from patterns that you see, like my south facing roofs are worse that my north, etc. This may help you to decide on which materials or even preventative measures that could be taken.
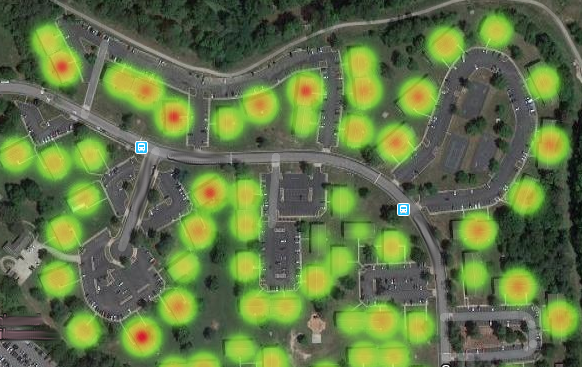
There are some free cloud-based programs that will do this, or maybe your current property management software does it. Either way, visual representations of data are consumed 60,000x faster than text, making this a fast and powerful way to filter through the noise and identify problem areas.
3. Service Cycle Times & Resident Feedback
Budgeting for staffing of your onsite maintenance teams is a pretty easy task, right? Maybe, maybe not. Not every site is the same across portfolios - older sites require more repairs; higher-end sites may require a higher level of service, etc. Pretty obvious - so how can maintenance data help?
At the end of the day, your residents will tell you how your are doing, which can assist you in determining if your sites are staffed correctly. Be comparing Resident Feedback with your Service Cycle Times, you will be able to identify sites that are over/under performing.
Service Cycle: this is the total elapsed time from when a resident reports a service issue (creation_time) to the time at which is was successfully resolved (completion_time).
These two metrics have a direct inverse relationship - when one goes up, the other goes down and visa-versa. This is something we track obsessively for our clients and one they have come to rely on as the at-a-glance metric for assessing the operational-maintenance health of a every property in a portfolio.
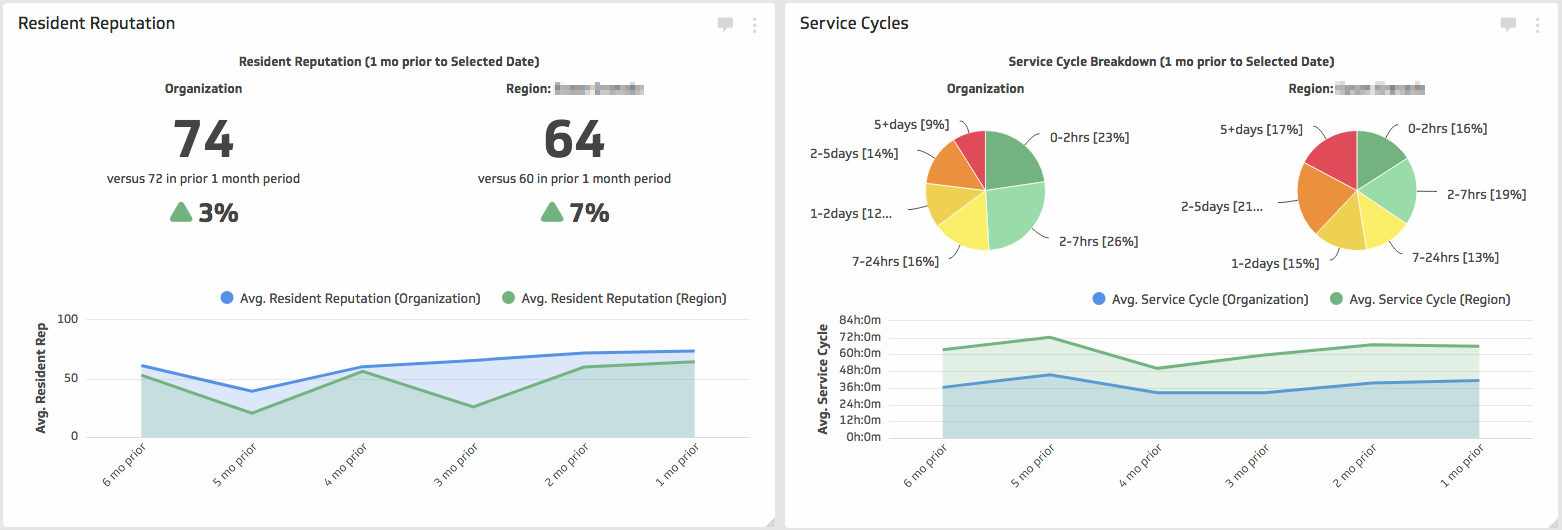
For budgeting purposes, this relationship can help you assess whether you got it right last year, or help with justification for additional resources.
We talk more about key observations between resident feedback and service cycle times here.
4. Vendor Spend
Keeping track of vendor spend is no trivial task, especially when you depend on them for all aspects of your maintenance operations (resident requests, make-ready, and preventative maintenance). Having some real-time data on how much you are spending on vendor services per-unit-per-month is an essential piece to your overall budget puzzle.
A combination of vendor spend in addition to the categories/types of requests that you typically outsource can help you to determine whether or not that extermination technician needs a place in your budget for next year. Or, based on your spend, maybe you can renegotiate service rates based on your volume and eke out some saving - everything matters, right?!
Conclusion & Ask
At the end of the day, the empirical data gathered by a simple analysis of these four areas should not only help you lock in on your 2019 maintenance budget, but also prove helpful in justifying your numbers to the owner(s).
Are there other ways that your firm has successfully and impactfully used maintenance data to help with the budgeting process? Please leave comments below - would love to hear from you!
Good luck this budget season!


